
Statistics
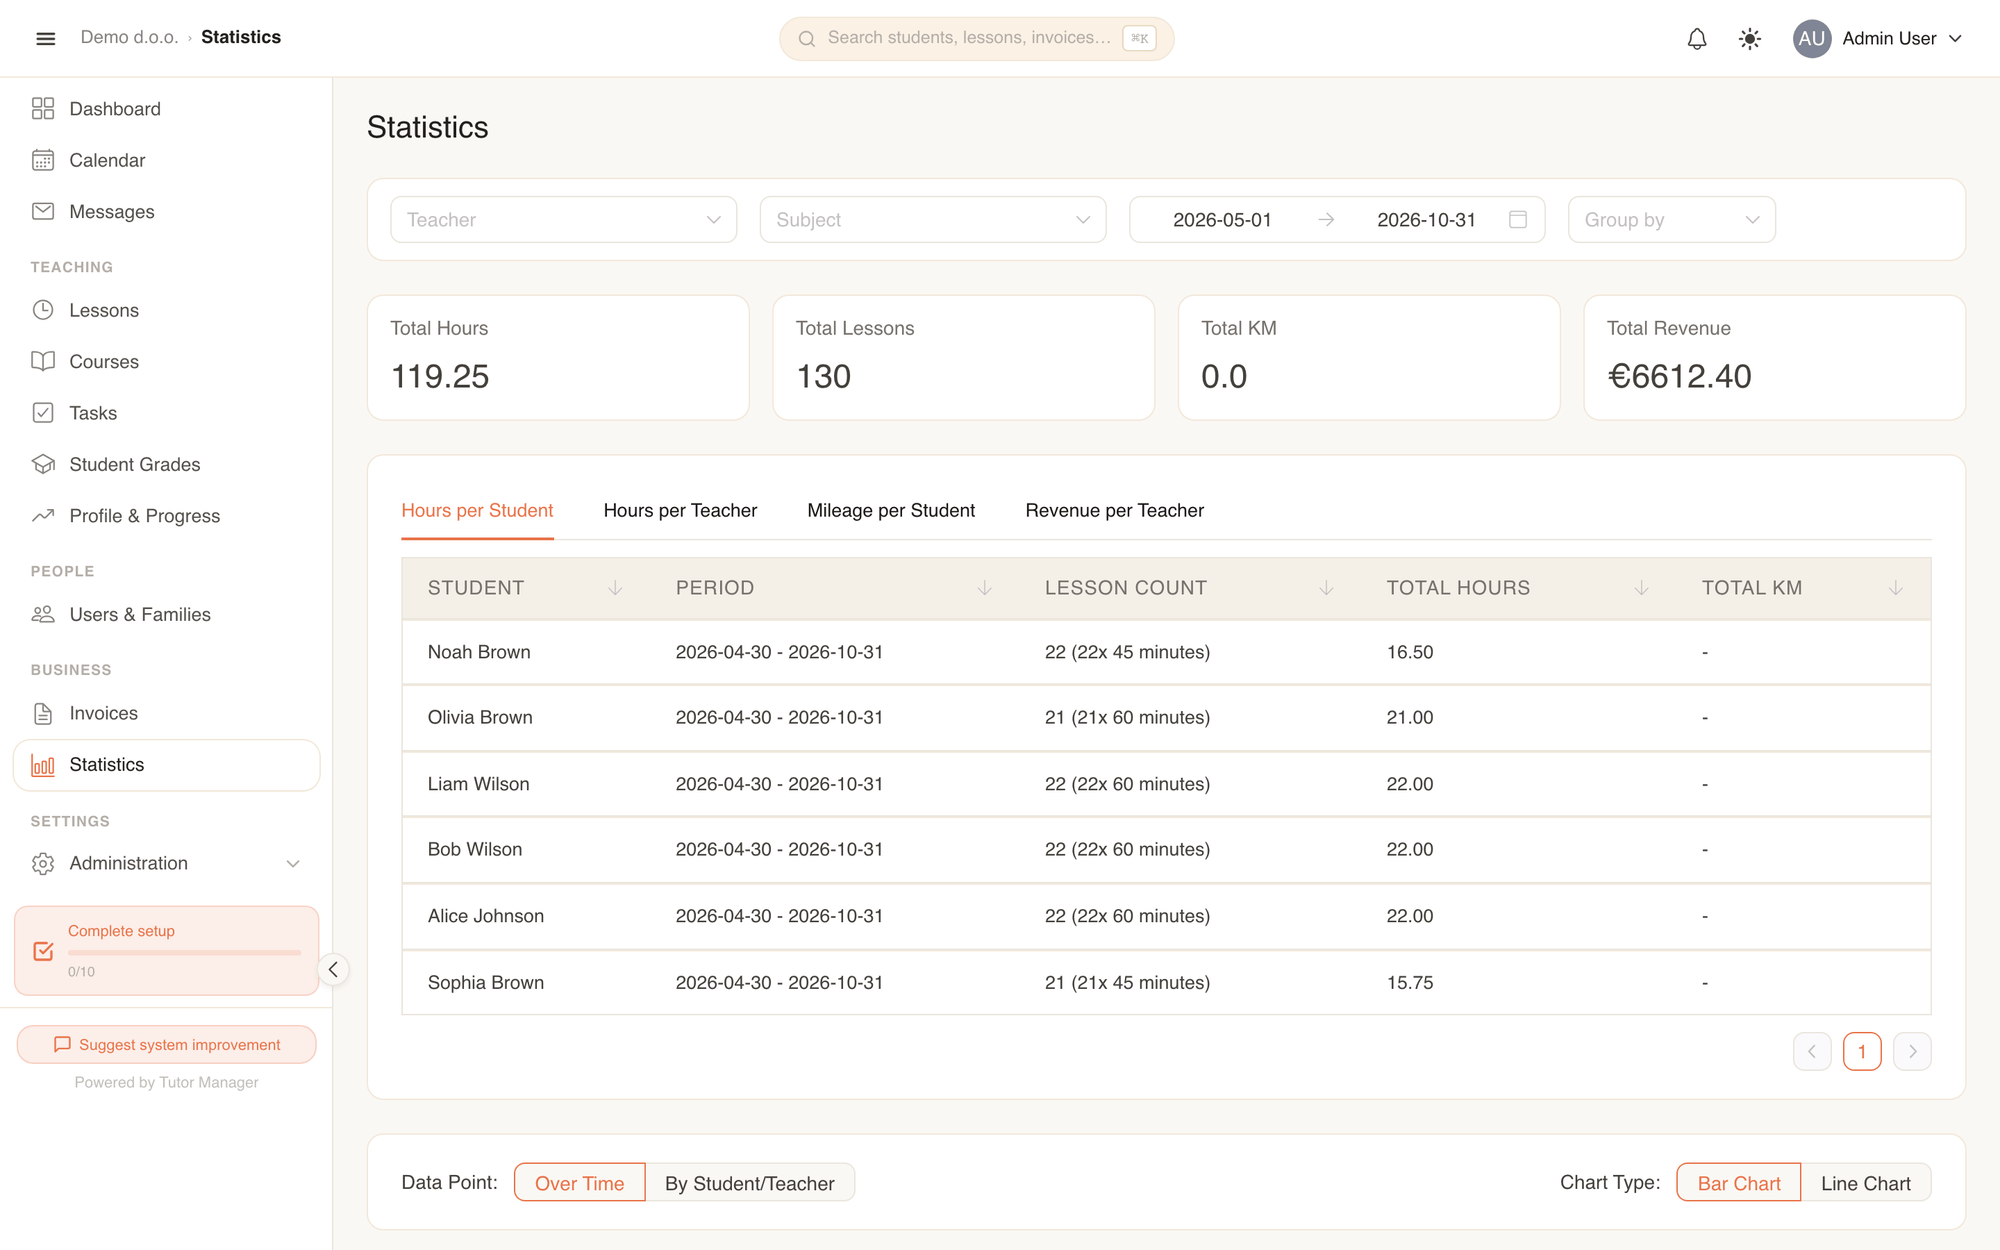
The Statistics page provides comprehensive teaching and business analytics. School administrators can monitor overall performance across all instructors and subjects, while teachers can track their individual teaching hours, student sessions, travel distances, and revenue.
Available to:AdminReceptionistTeacher
Who sees what
TutorManager customizes the analytics view depending on user role:
- Administrators & Receptionists: See school-wide totals for all teachers and students. An additional Teacher filter dropdown allows isolating data for any specific instructor.
- Teachers: See their own metrics exclusively — total hours taught, number of completed lessons, accumulated mileage for home visits, and earned revenue.
Filters and date ranges
Customize your analytics using the top filter controls:
| Filter | Description |
|---|---|
| Teacher | (Admins only) Select an individual teacher or leave empty to view data for the entire school. |
| Subject | Filter metrics for a single academic subject (e.g. Mathematics or German). |
| Date range | Set custom start and end dates or choose one of the quick presets: This Month, Last Month, This Week, Last Week, This Year, or Last Year. |
| Group by | Group aggregated records by Total, By Day, By Week, By Month, or By Year. |
Summary KPI cards
Four high-level metrics update dynamically based on your chosen filters:
- Total Hours: Cumulative teaching duration across completed lessons.
- Total Lessons: Count of completed individual and group lessons.
- Total KM: Total distance traveled for lessons conducted at clients' homes.
- Total Revenue: Financial value generated from lessons and course attendance.
Detailed analytical tabs
Below the summary cards, four dedicated tabs provide detailed breakdown tables:
| Tab | What it shows |
|---|---|
| Hours per Student | Itemized breakdown of lessons, total hours, and subjects per student. |
| Hours per Teacher | Comparative overview of workload and hours taught across teachers. |
| Mileage per Student | Records of home visits, distance driven in kilometers, and calculated travel costs. |
| Revenue per Teacher | Financial performance and turnover generated per instructor. |
Interactive charts
At the bottom of the page, visual charts help identify trends over time:
- Data Point:
- Over Time: Visualizes changes across days, weeks, or months to highlight seasonal peaks.
- By Student/Teacher: Compares values directly across individual teachers or students.
- Chart Type: Switch between Bar Chart for discrete comparisons or Line Chart for trend analysis.